Unit V: Westward Expansion and Regional Differences |
|---|
| www.studenthandouts.com > U.S. History > Westward Expansion > Maps & Pictures |
 |
 |
 |
 |
|||||||
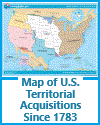
| Wild West Clip Art Gallery | William Henry Seward (1801-1872) | Frontiersman | Map of U.S. Territorial Acquisitions Since 1783 |
|
Maps and pictures are powerful visual aids that can significantly enhance American History students' understanding of westward expansion and its connection to the disputes about the expansion of slavery in the United States.
Geographic Context: Maps provide students with a clear geographical context, allowing them to see the locations of territories, states, and regions involved in westward expansion. They can visualize the vastness of the American frontier, the westward movement of settlers, and the evolving borders. Territorial Changes: Historical maps can illustrate the changing boundaries of the United States over time. Students can observe how territories were acquired through treaties, purchases, and annexations, such as the Louisiana Purchase and the Oregon Trail's route. Distribution of Slavery: Maps can depict the distribution of slavery in the United States during different periods. Students can see how slavery expanded into new territories and states, leading to debates and conflicts over its presence in newly acquired lands. Missouri Compromise Line: Maps can highlight the Missouri Compromise line (36°30' parallel) and its significance in the restriction of slavery's expansion. Students can visualize how this line was used to determine whether newly admitted states would allow slavery or not. Compromise of 1850: Visual resources can illustrate the territories affected by the Compromise of 1850, which included the admission of California as a free state and the organization of the Utah and New Mexico territories with the principle of popular sovereignty. Kansas-Nebraska Act: Maps can show the areas impacted by the Kansas-Nebraska Act of 1854, which allowed settlers to determine whether slavery would be allowed in the Kansas and Nebraska territories. Students can see how this led to violence and conflict in "Bleeding Kansas." Dred Scott Decision: Visual aids can help students understand the implications of the Dred Scott decision by depicting the territories and states affected by the ruling that African Americans, whether enslaved or free, could not be U.S. citizens and that Congress could not regulate slavery in the territories. Election of 1860: Maps can display the electoral results of the 1860 presidential election, showing how Abraham Lincoln's victory as a Republican candidate led to secession and the formation of the Confederate States of America. Underground Railroad: Visual resources can illustrate the routes of the Underground Railroad, a network of safe houses and secret routes used by enslaved people seeking freedom in the North. This helps students understand the escape routes and challenges faced by those fleeing slavery. Primary Source Images: Pictures and photographs from the era can provide students with visual insights into the lives of settlers, Native Americans, enslaved individuals, and abolitionists during westward expansion. These images bring history to life and can evoke empathy and understanding. Incorporating maps and pictures into lessons about westward expansion and slavery disputes engages students visually and helps them connect with the historical events and figures of this period. It allows for a deeper and more memorable understanding of the complex factors that shaped the nation during this transformative era. |
| www.studenthandouts.com > U.S. History > Westward Expansion > Maps & Pictures |


